If You want to create a dashboard in Google Data Studio and show for example your Facebook Ads statistics – you can use Pipelinica. There are basic steps in order to create such a dashboard:
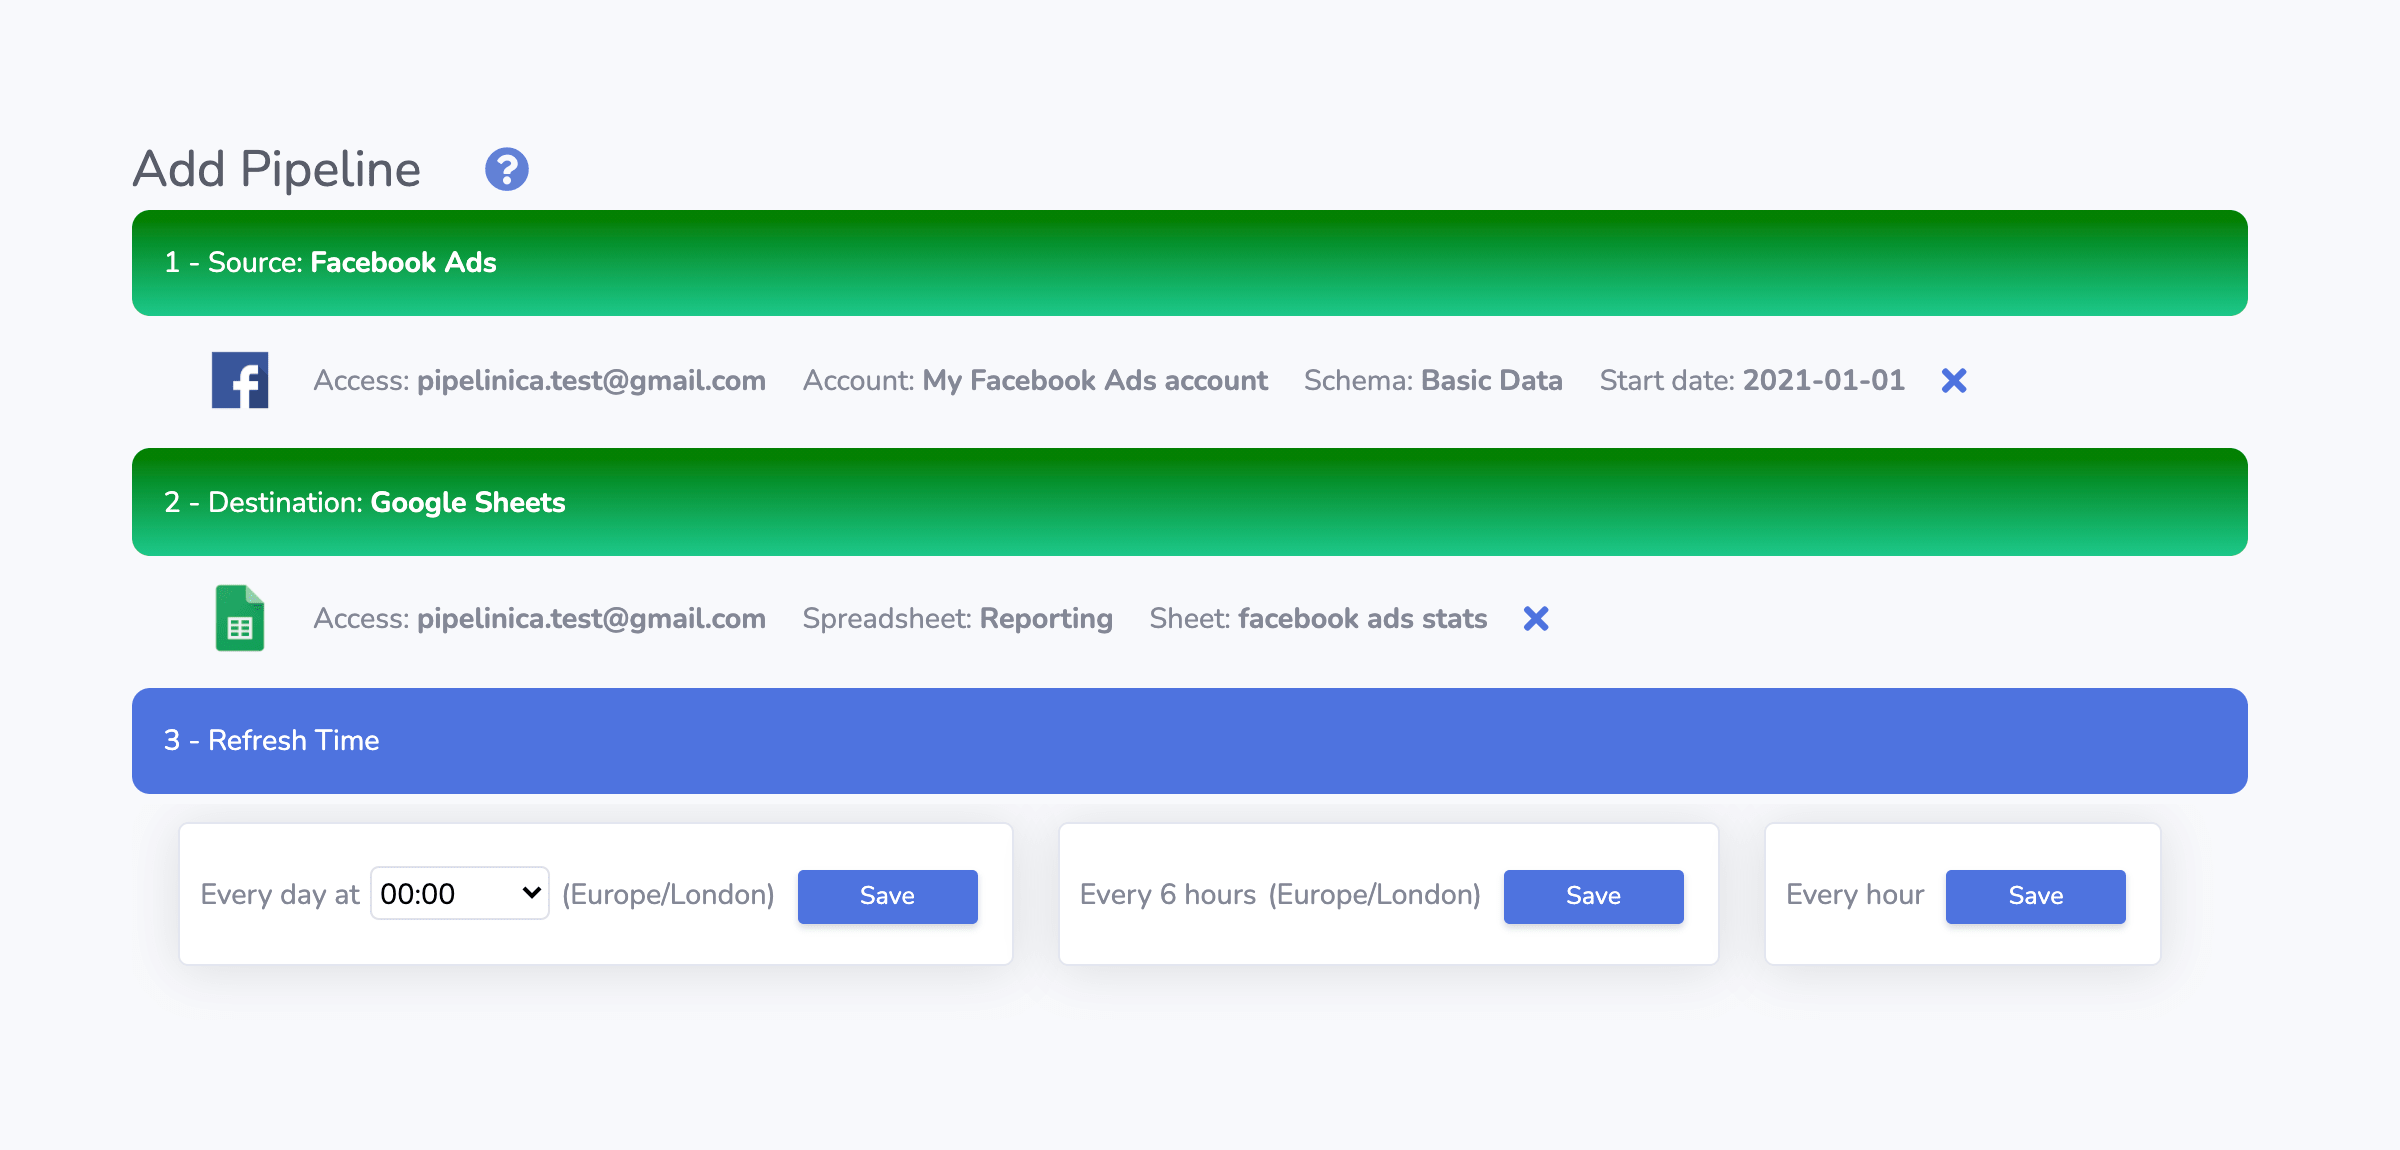
- In Pipelinica app – create a data pipeline with appropriate data source, and Google BigQuery or Google Sheets data destination. For example: from Facebook Ads to Google Sheets:

- As a result – You should get your Facebook Ads statistics in Google Sheets or BigQuery table:
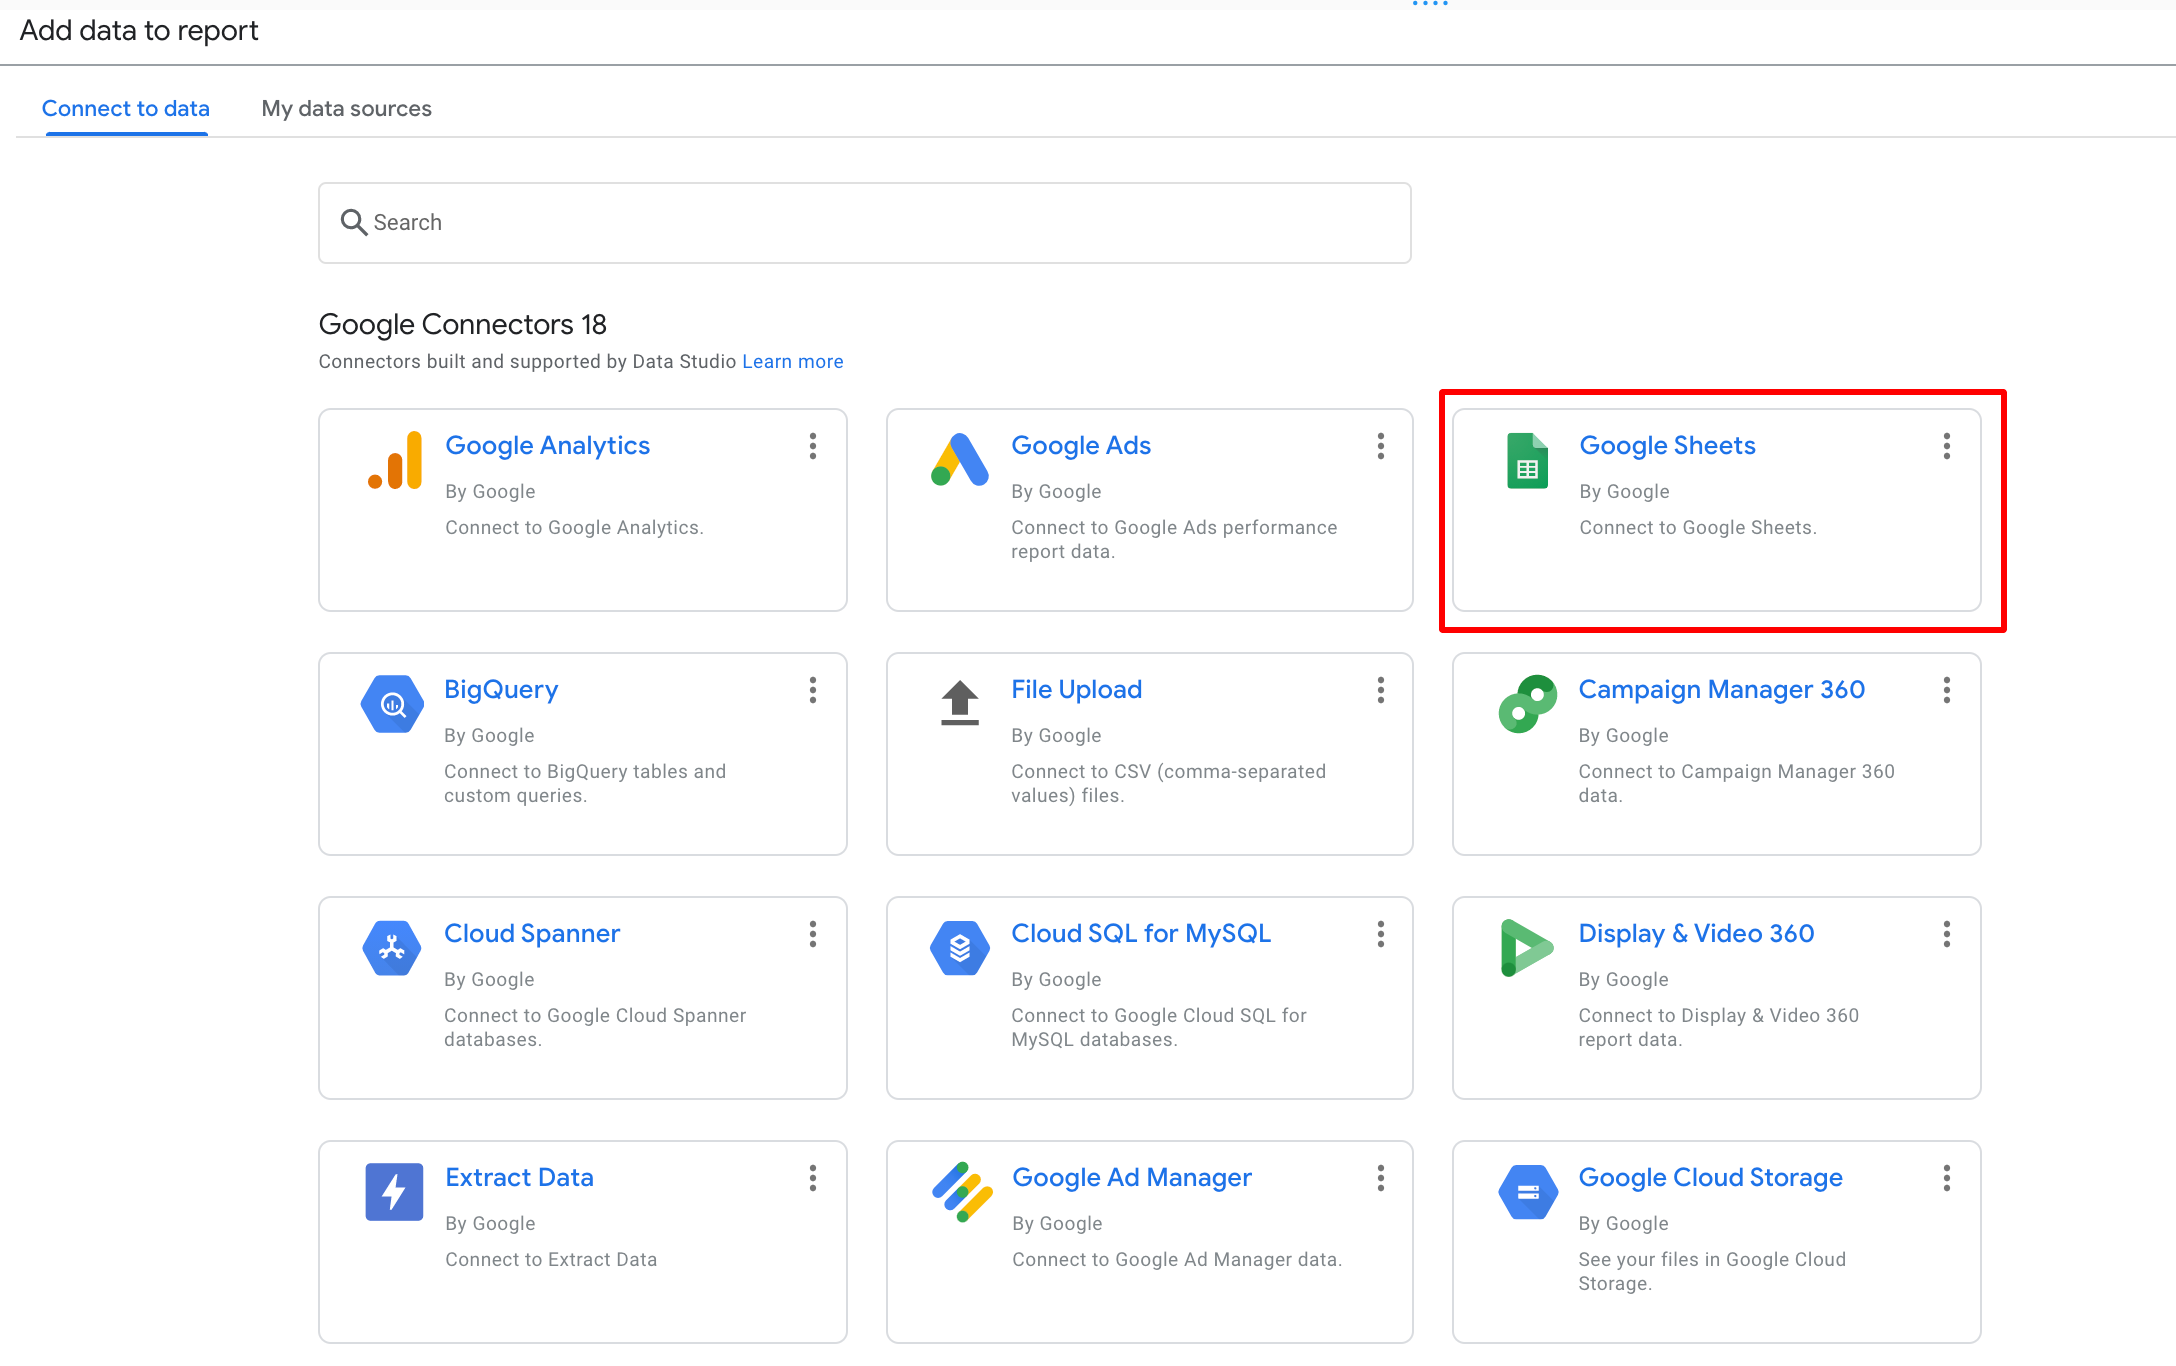
- Use default Data Studio connectors in order to create a data source with your statistics, for example use Google Sheets connector if you decided to export your data to Google Sheets:
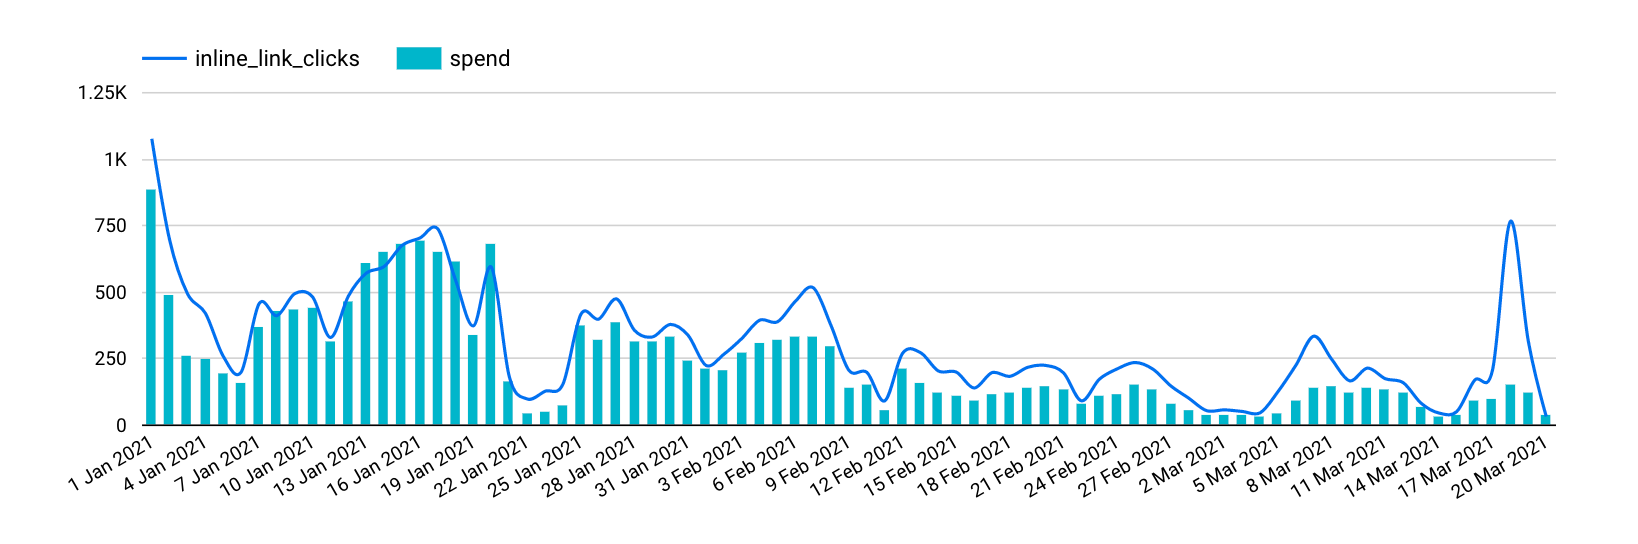
- Create charts and tables using recently created Google Sheets or BigQuery data source:

Pipelinica will keep refreshing your data according to selected schedule so your reports always will be up to date.
If you still have any questions – feel free to contact us HERE, or use Live chat.