In this article you will find out how to create scheduled report in Google Display and Video 360, so you can use it as a source in Pipelinica data pipeline.
- Log in your Google Display & Video account: http://displayvideo.google.com/
- Now click on a chart icon like below:

- Select “Reports” option:
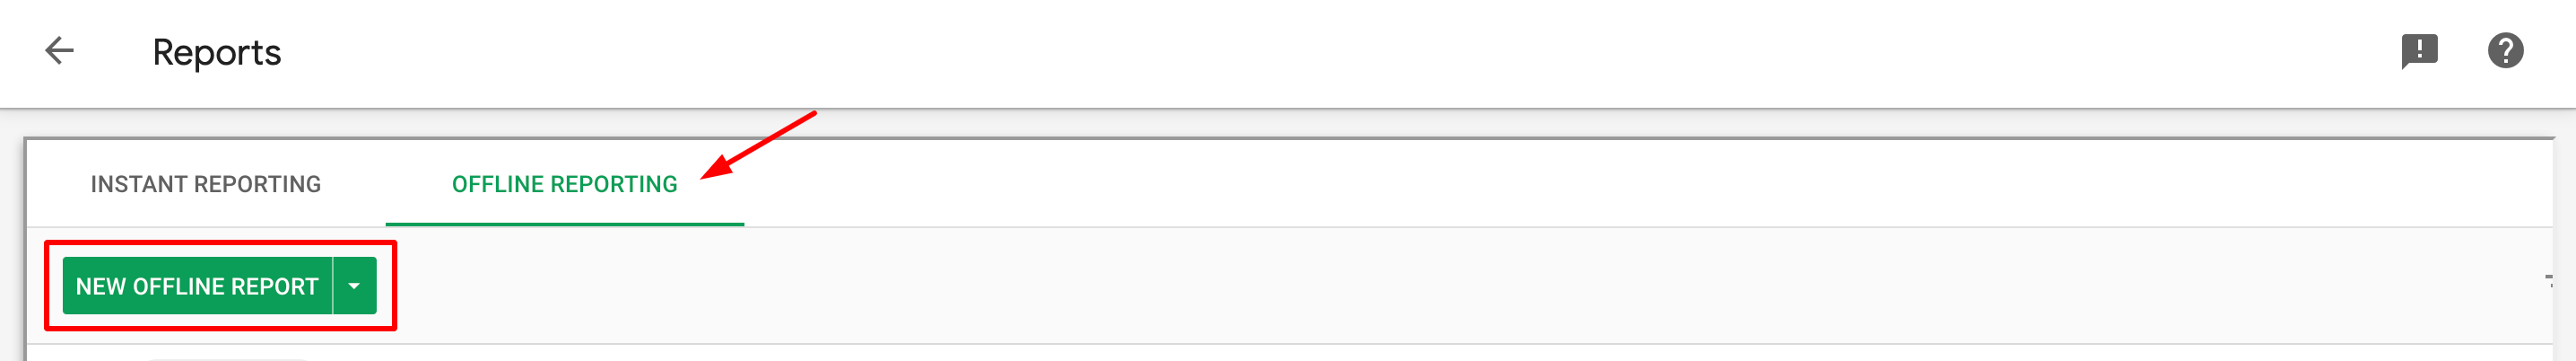
- Go to “Offline Reporting” section and click “New Offline Report”:
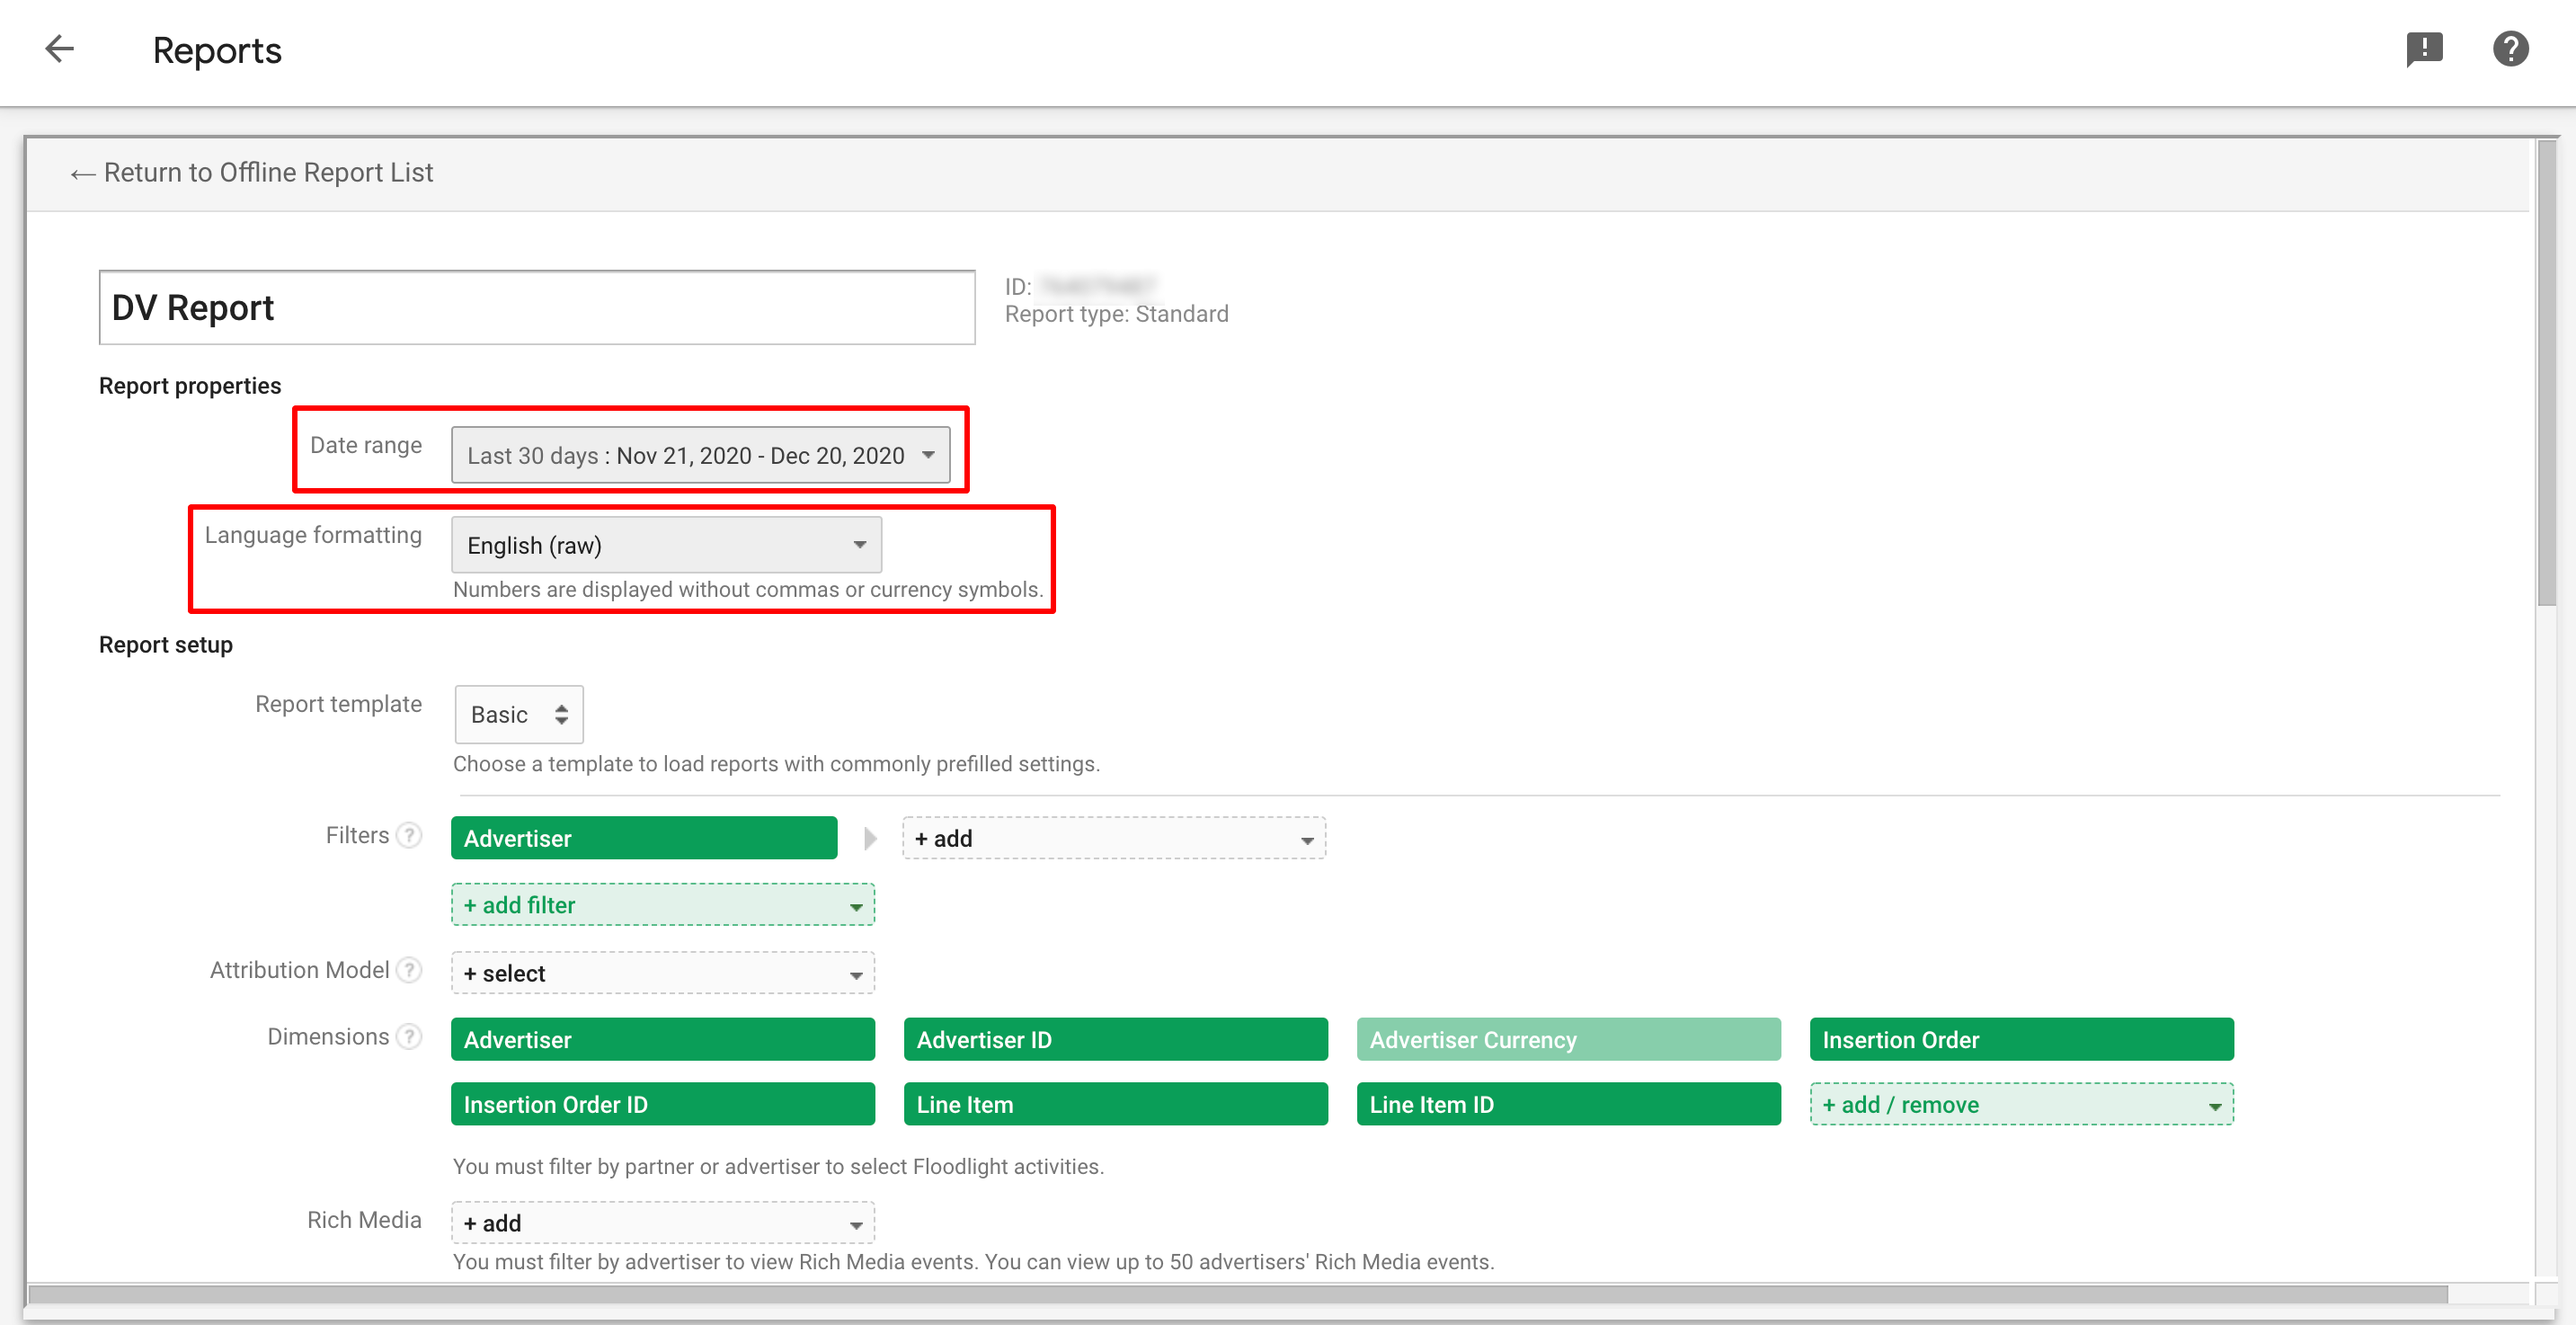
- Give you report any name, and select dynamic date range. For example “Last 30 days” or “Last 60 days”. It means that data destination will be overwritten everyday by selected amount of days, but older data will stay and will not disappear. Also select English language formatting:
- Now you can select any dimensions and metrics you want to appear in your report. You can also choose any templates, apply filters, etc.
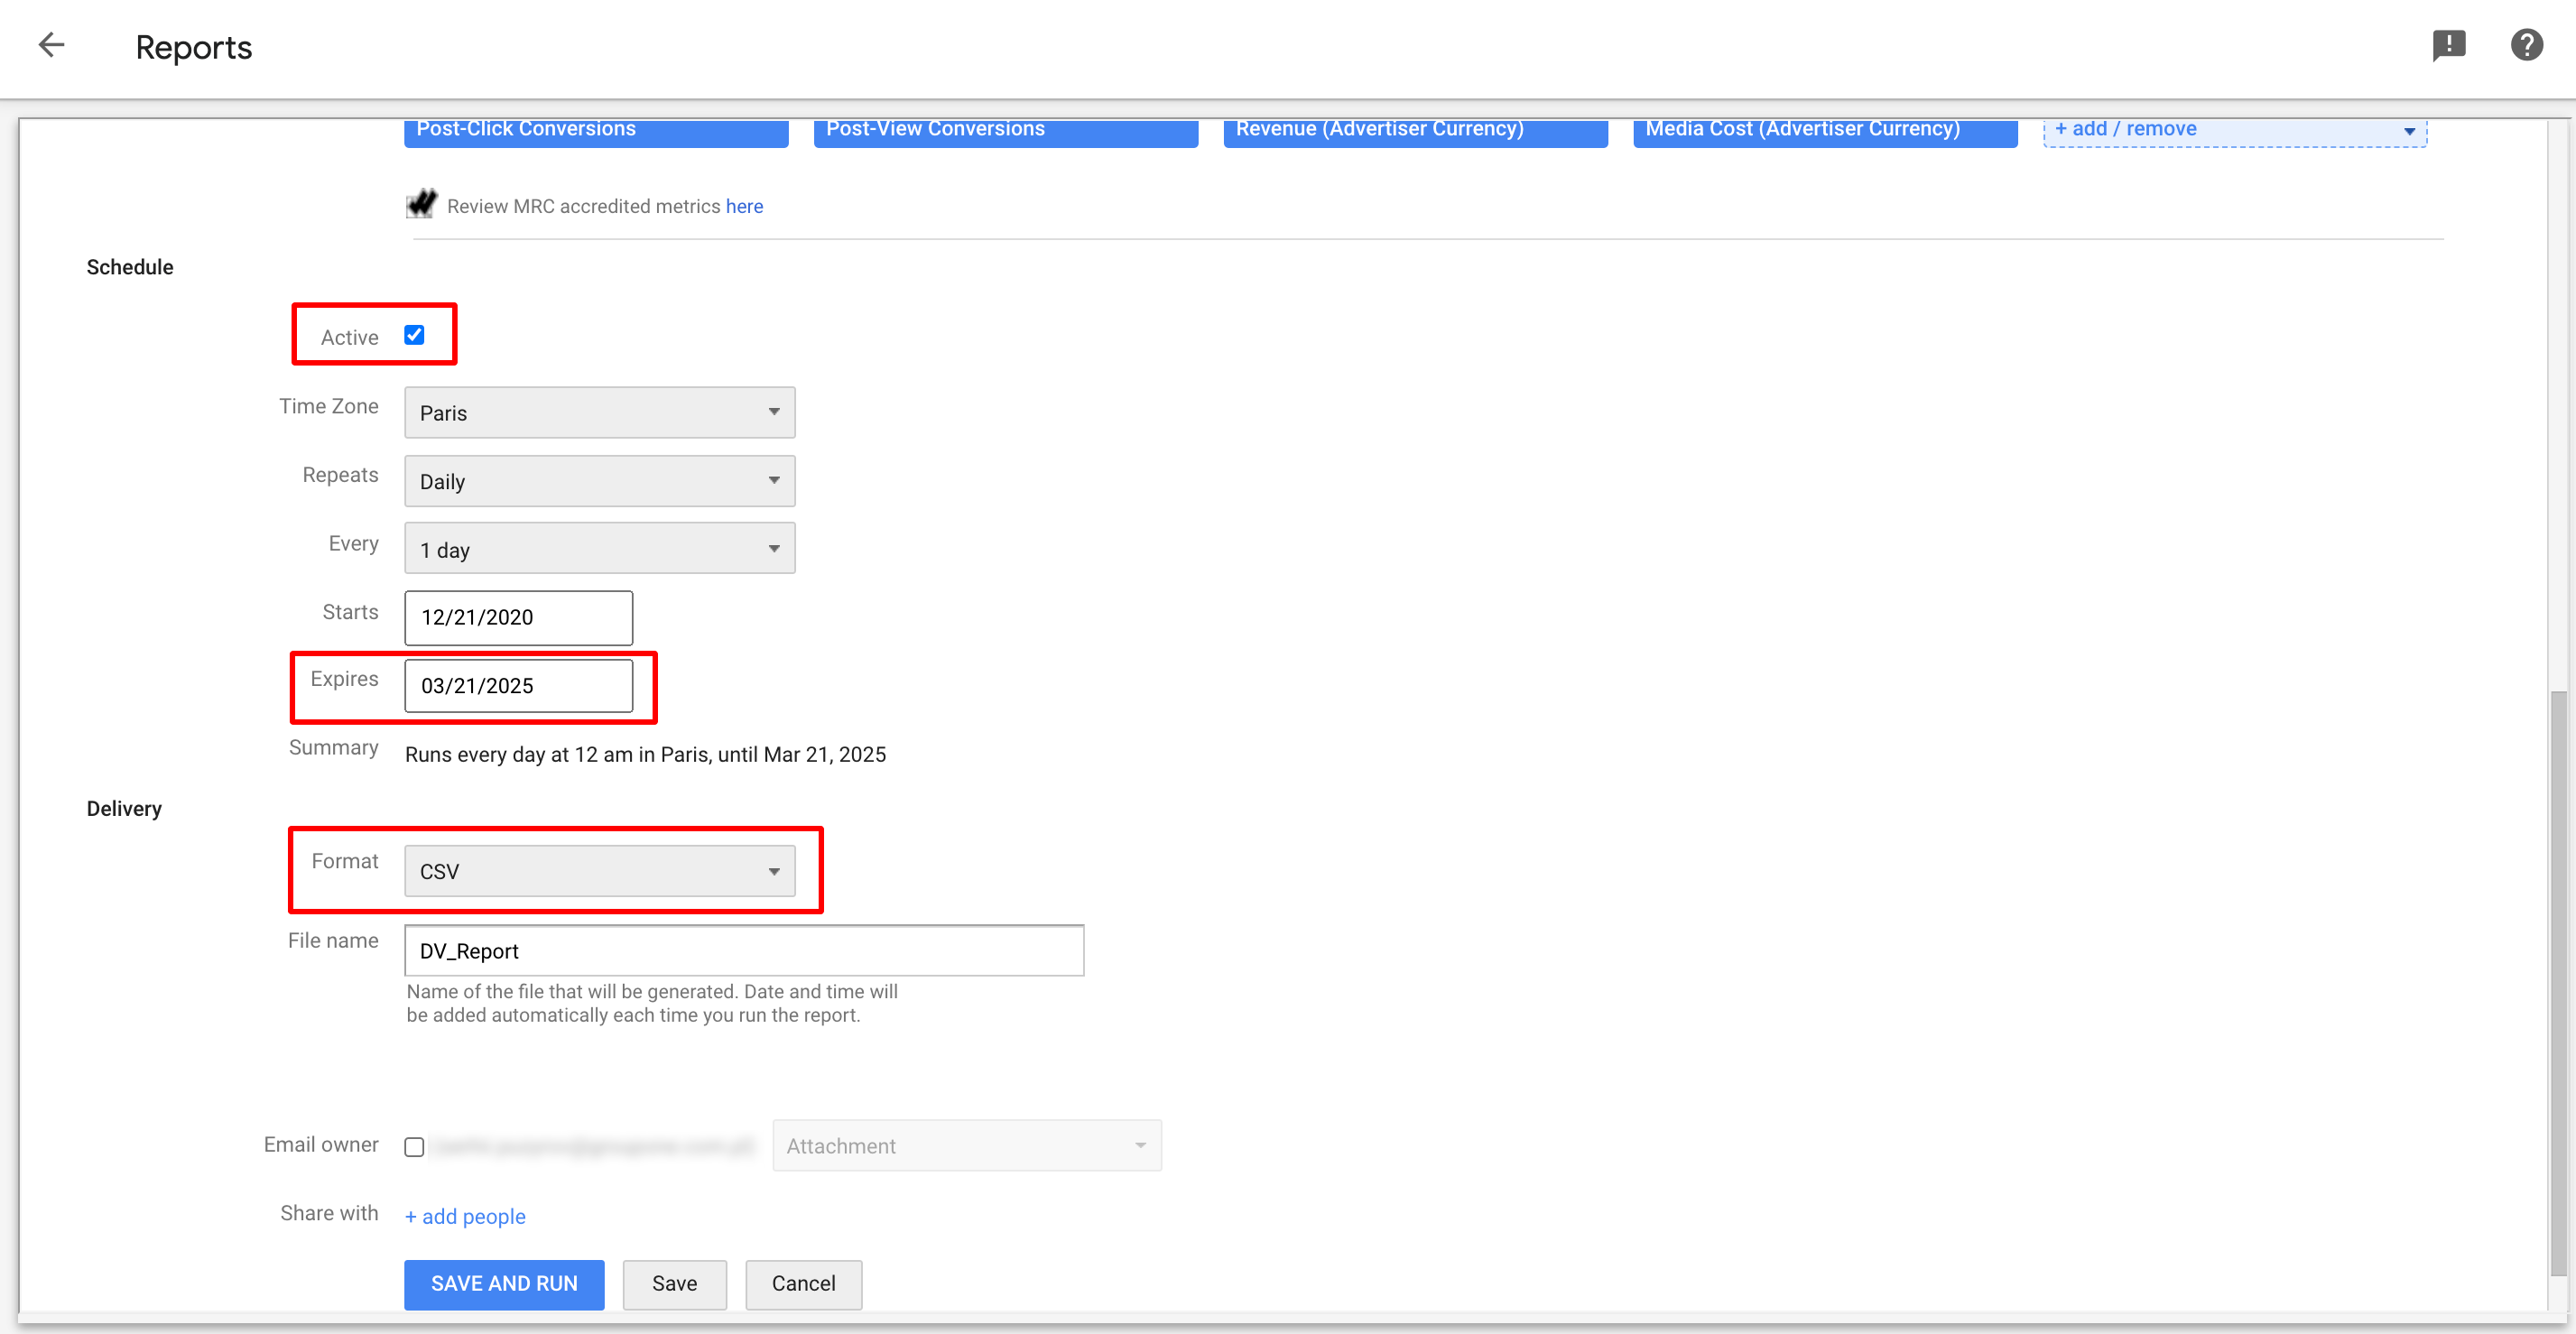
- Scroll down and select schedule as Active (thanks to that report’s data will be refreshed every day), decide when schedule can be expired and select format as “CSV“:
- Now – click “Save and Run” button. After that you can add this report in your pipeline as a data source.


Congratulations, now you can use this Google Display and Video 360 scheduled report as a data source in Pipelinica data pipeline. If you have any questions – feel free to contact us HERE, or use Live chat.